Should climate policy aim to avoid 2°C or to exceed 2°C?
COMMENTARY: There are different ways to define carbon budgets, and a particularly important distinction is between the two concepts of avoiding a temperature target and exceeding a temperature target. Understanding the difference between these two concepts goes a long way to explaining different types of budgets.

In a previous post, I discussed how one may update carbon budgets using data presented in the IPCC Synthesis Report.
The remaining carbon budget gives a nice round number. To stay below 2°C, we can only emit another 800 billion tonnes CO2. At current emission rates, that will happen in about 20 years.
The carbon budget for 1.5°C is even starker. Some estimates say we can only emit another 150 billion tonnes CO2 before we “use up” a 1.5°C carbon budget, and that will happen in about 4 years.
What does it mean to “use up” the carbon budget in 4 years?
Does that mean we will exceed 1.5°C in four years? We are currently at about 1°C, and to go to 1.5°C in four years would require unprecedented rates of temperature change.
What if we want to stay below 1.5°C? Does that mean we still “use up” the budget, but over a longer time-period?
Avoidance and Exceedance
In this blog, I will dig into more detail on the “Threshold Exceedance Budget” and the “Threshold Avoidance Budget”. I touched on this in my earlier post, but a recap is needed.
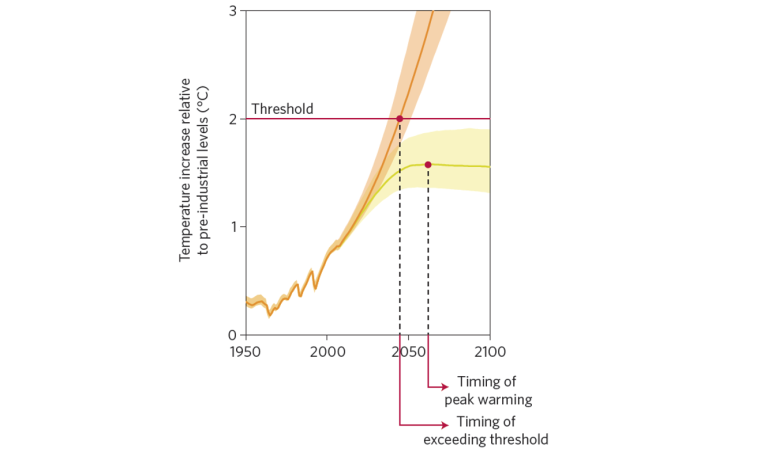
Conceptually, the difference between an avoidance and an exceedance budget is quite easy to show. The cumulative emissions that define the carbon budgets are calculated to the time of exceedance of a temperature threshold, or at the time of peak warming for the avoidance approach.
With that simple schematic behind us, what does it mean if we look at some real numbers? The IPCC Working Group 3, Chapter 6, assessed about 1200 emission scenarios. Of these 1200, only about 520 have sufficient data to analyse carbon budgets for a given temperature target.
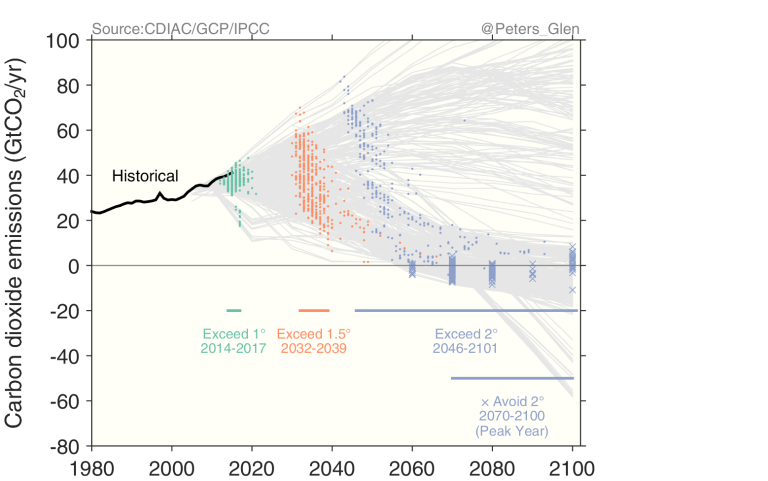
The dots in the figure (green, orange, and purple) are when different temperature targets will be exceeded in a subset of the scenarios assessed in the IPCC Working Group 3 database.
According to the scenarios, we most likely exceeded 1°C between 2014-2017. We have already “used up” the carbon budget for 1°C, and real temperature measurements confirm this. The models work!
A temperature of 1.5°C is likely to be exceeded sometime between 2032 and 2039 depending on the pathway we take, and 2°C sometime in the latter half of the century.
The avoidance budget for 2°C is calculated from the purple crosses in the figure. In these scenarios, we successfully mitigate to avoid straying above 2°C. The carbon budget is then calculated at the time of “peak temperature”, which generally occurs after 2060, and at about the same time that global net emissions drop below zero.
OK, so we have learnt that the carbon budget concept we choose leads to significant variation in the time that a temperature target will be avoided or exceeded. But does this effect the size of the carbon budget?
Quantifying carbon budgets using the different concepts
As it turns out, the carbon budgets are quite different for the avoidance and exceedance approaches.
The avoidance budgets are clearly smaller than the exceedance budgets. Why do we have to emit more to exceed a target?
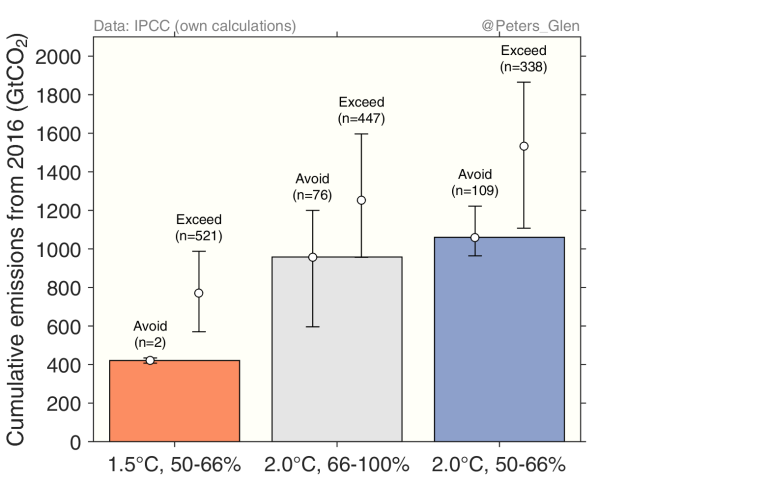
The exceedance budgets are larger due to the inertia in the climate system: the global warming effect of an emission is delayed by about 10 years. Given today’s emission level of about 40 billion tonnes CO2, the exceedance budget should be about 400 billion tonnes CO2 larger (40×10), rather consistent with the difference between the avoidance and exceedance budgets in the figure.
Conversely, we would have emitted enough to exceed a given temperature target about 10 years earlier than indicated in the figure, since it takes about 10 years before that temperature is realized. In effect, the exceedance budgets should be about 400 billion tonnes CO2 smaller than in the figure to allow for this inertia in the climate system. With this adjustment, there is much greater consistency between avoidance and exceedance budgets.
The small remaining carbon budget for 1.5°C is useful as an illustration.
If we continue emitting as we are today, then we will cross 1.5°C in the 2030’s, and by that time, we would have emitted around 750 billion tonnes CO2. But even if we somehow managed abruptly to stop emitting at that time, temperatures would continue to rise beyond 1.5°C for another 10 years or so due to the inertia in the climate system.
If, on the other hand, we mitigate aggressively to stay below 1.5°C, peak warming will be reached sometime later this century. Total cumulative emissions at that time will be no more than around 400 billion tonnes CO2.
The exceedance budgets are not that useful: they don’t integrate the inertia of the climate system, and they mean that we will exceed our temperature target! Under false pretences, they tempt us to emit more than we should!
Climate policy is based around the Paris Agreement, which is very clear that we will try to avoid 2°C, and it makes much more sense to use an avoidance budget.
Why is there such a large range in the budgets?
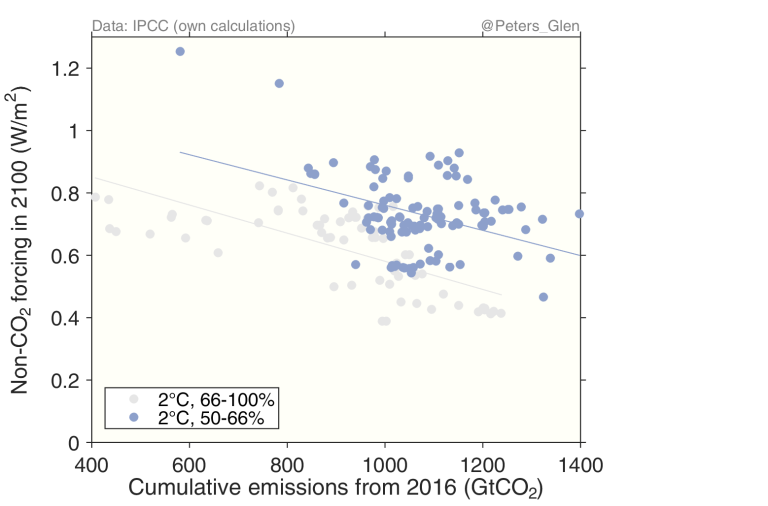
Even if we use an avoidance budget, there is a rather large range in the carbon budgets, almost from 600-1200 billion tonnes CO2 for a 2°C avoidance budget with a 66% chance.
The main difference is due to non-CO2 emissions. It is not just carbon dioxide that causes global warming. Methane (CH4) is the next largest contributor to global warming. Some other species, such as sulphur dioxide (SO2), cause cooling, particularly due to direct and indirect aerosol effects.
It is all these non-CO2 emissions, which vary from scenario to scenario, that are the main cause of the large range in carbon budgets.
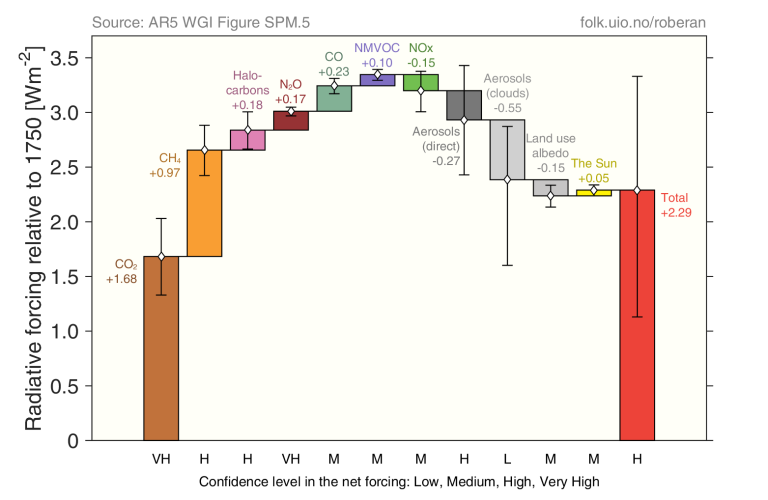
For each temperature target and probability, a smaller carbon budget generally means the scenario has a higher radiative forcing from non-CO2 emissions. This means that the non-CO2 emissions, collectively, cause a warming, meaning that less CO2 can be emitted.
Clearly, if we mitigate non-CO2 emissions then we get a little more space for CO2 emissions. Though, either way, CO2 emissions still need to go to zero to avoid exceeding the carbon budget.
Important inconsistencies
There are four key inconsistencies that should be noted in this discussion.
First, the carbon budgets reported in this blog post are slightly larger than those reported in the previous post. This is since I have used the scenarios directly, and therefore have not updated the historical emissions over the period 1870-2010. This would make the budgets about 100 billion tonnes CO2 smaller.
Second, each temperature target and probability band has a different number of scenario (the n in the above figures), and sometimes from different models. This means that it is very hard to consistently compare across different temperature targets and probability levels. To be comparable, we would really need the same number of scenarios from the same models.
Third, in the previous post, exceedance budgets were from ‘complex models’, but they are rather different to the exceedance budgets from the ‘simple models’ shown here. In my view, this is since the probability between the two sets of models is not consistently defined. The ‘complex models’ aim to represent the climate system as we observe today, so the parameters of each model attempt to reflect the average observed state of the climate system. The ‘simple models’ are used in a probabilistic mode, and thereby fully explore the uncertainties of the climate system. Put simply, the probabilities are measuring something different.
Fourth, it is quite easy to get the impression that it is not possible to emit more than allowed in the carbon budget. In fact, it is quite possible to exceed the carbon budget using negative emissions. This will be the topic of another post.
Moral to the story
This has been a rather complex blog post, weeding out some important technical differences between different carbon budgets.
The definition of how the carbon budget is derived is very important, and I recommend using a budget that avoids the temperature threshold, rather than exceeds it.
For a given temperature and probability, there is a large range of carbon budgets. Much of the variation is explained by non-CO2 emissions, which have important effects on the climate.
As I concluded in the last post, the implications remain unchanged despite the technicalities: carbon dioxide emissions need to go to zero, probably sometime around 2050 for a good chance to keep below the 2°C temperature target.
We have yet to discuss the implications of negative emissions, and that will be the topic for the next blog post on carbon budgets.