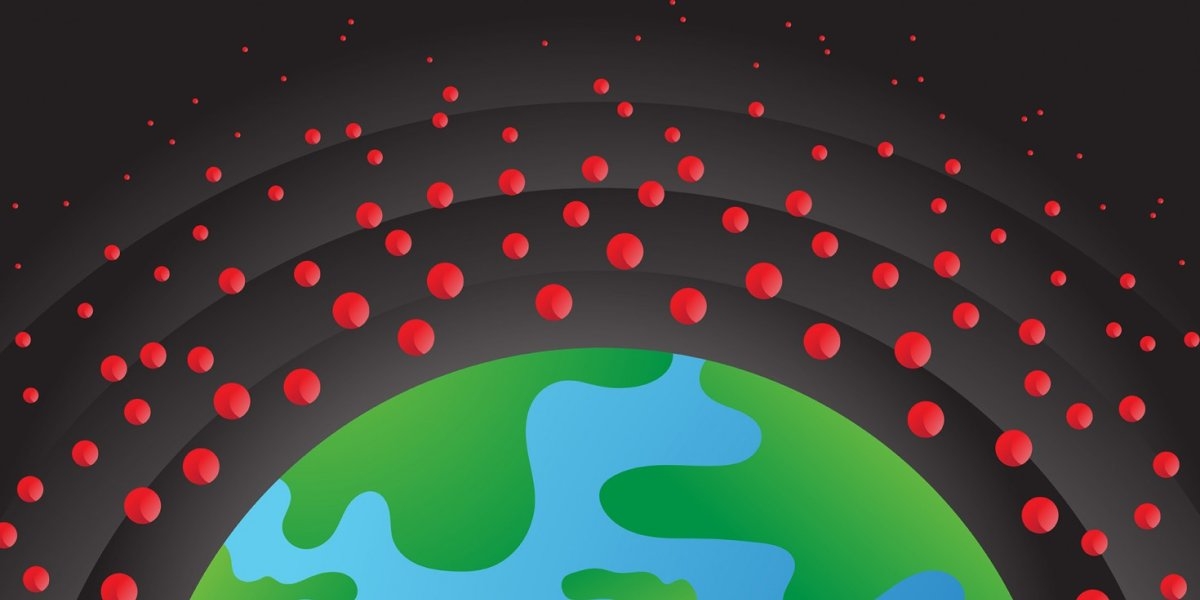
METANINNHOLDET I ATMOSFÆREN ØKER, MEN VI VET IKKE HELT HVORFOR. ILLUSTRASJON: BYHANDS/ROBIN SNASEN RENGÅRD
How achievable is the Methane Pledge?
Tackling methane emissions now is a must in order to have a chance of limiting global warming to 1.5°C. The Methane Pledge is an international political initiative to reduce methane emissions 30% by 2030, but how likely is this and where would these reductions come from?

The Methane Pledge was one of the main outcomes of COP26 in Glasgow last November and, if delivered, it could have real benefits for climate in the near term1. More than 100 countries signed up to the Methane Pledge and, thereby, agreed to cut their methane emissions 30% by 2030 relative to 2020 levels. Methane is a potent greenhouse gas - 81 times more powerful than CO2 (on a 20-year time scale) - and is relatively short-lived staying in the atmosphere for only about 12 years2 compared to hundreds of years for CO2. Therefore, reducing methane emissions would lead to a reduction in atmospheric levels within a few years, and most importantly, a reduction in global warming and help mitigate severe global warming this century.
If the Methane Pledge is successful it could lead to a ~0.2°C reduction in temperature1,3 and help keep global warming below 1.5°C until at least 2050, a threshold at which more extreme events such flooding, drought, and severe heatwaves might be avoided4.
Recent trends in atmospheric methane, however, show that emissions are not going down, but rather have increased since 2007 (Figure 1). Therefore, how likely is a global reduction in methane emissions of 30% and where would these reductions come from?
The largest sources of methane from human activities are from fossil fuel use (36%), agriculture (38%), and waste (18%)5. In addition, there are considerable natural sources such as wetlands, however, these are not targeted by the Methane Pledge.
Fossil fuel emissions arise with the extraction of coal, oil and natural gas, and for natural gas, also from its storage and transport. Some oil and gas facilities have such large emissions that they can be seen by satellite - these “mega-emitters” are responsible for about 8-12% of total oil and gas emissions globally6. Agricultural emissions are largely due to livestock, especially cattle, and rice cultivation, while waste emissions are due to the breakdown of organic matter in landfills and other waste disposal facilities, including wastewater. Emissions have increased in the 20th century and into the 21st century (Figure 2) and evidence from atmospheric methane concentrations measured globally, strongly suggest important increases in emissions over the past decade7. Moreover, coal, oil and gas, and waste production, as well as livestock numbers, are projected to increase globally to 20308,9,10 (Figure 3) making mitigation of methane emissions even more challenging. In particular, production in non-OECD countries is expected to increase in all sectors due to growing population and, along with this, food and energy demands.

Figure 2. Historic methane emissions from major sources and a linear emission trajectory to a 30% reduction by 2030 relative to 2020 levels. The total emission is shown by the black line. The emissions are given in Teragrams (1012 grams) of methane per year. (Historic emissions from https://edgar.jrc.ec.europa.eu).

Figure 3. Historic production of coal, oil and gas, waste (solid only), livestock (cattle only) and rice up to 2020 and the projected production to 2030. Productions are given in Petagrams (1015 grams) except livestock which is given in millions of animals.
According to a recent study of the Climate and Clean-air Coalition (CCAC), a 30% reduction in total emissions would be most achievable by a 60% reduction in fossil fuel, 20-25% in agriculture and 30% in waste emissions11.
Fossil fuel emissions are thought to be a low-hanging fruit since technologies already exist to mitigate the emissions. For oil and gas, this includes detecting and repairing unintended leaks and recovering or flaring of vented gas. Leak detection capabilities are rapidly expanding with large leaks detectable by satellite6, with new satellite missions promising even better detection capabilities12,13, and smaller leaks detectable by infrared cameras onboard vehicles and aircraft14. Underground coal mines are also methane hotspots, but emissions could be reduced by oxidising methane in ventilated air14,15. Despite technical feasibility of reducing the emission intensity with respect to production, the increases in production anticipated (16% for oil) means that the actual emission savings with respect to 2020 levels will be more modest compared to the CCAC scenario. Based on a recent study reviewing emission reduction technologies16, and assuming that these would be steadily put into place from 2022, the savings may only be in the order of 37 Tg/y (Teragrams or 1012 grams) or equivalently 31% of 2020 levels17 (Figure 4).

Figure 4. Change in methane emissions in 2030 relative to 2020 for no mitigation (none), potential mitigation by global implementation of current technologies (feasible), and the sectorial targets according to the CCAC scaled to match a global total reduction of 30% (target).
In contrast to fossil fuels, reducing emissions from agriculture is not considered to be so straightforward. Nevertheless, emissions could be reduced by improved management of manure, e.g., using manure in anaerobic digestion plants for biogas, and through changes in animal feed and selective breeding. For rice, emission savings could be achieved by intermittently airing rice paddies and adding, e.g., sulfate16. What further helps is that increases in livestock numbers and rice production are likely to be modest, that is less than 10%. Altogether, the emission savings could be 37 Tg/y or equivalently 23% of 2020 levels17.
Lastly, both solid waste, such as in landfills, and wastewater production are expected to increase to 2030, especially in non-OECD countries. In some developed countries, especially in Europe, waste is already highly managed, with organic waste being diverted to composters and biodigesters and methane gas captured and used. Landfills are also heavily regulated and emissions are minimized by using special soil covers to encourage oxidation of methane before it reaches the atmosphere14. However, in developing (and even some developed) countries, there is little control of waste, and landfill emissions can be very large. Given that waste production is likely to increase most in developing countries, a lot of emissions could be spared by investing now in waste management. By employing existing technologies waste emissions could be reduced by 16 Tg/y or 21% of 2020 levels17, but if no action is taken, they could increase by more than 10%.
Overall, if existing technologies to reduce emissions would be implemented at a steady rate from today until 2030, globally methane emissions could be reduced by about 24% relative to 2020 levels. If nothing is done emissions could increase by 8%. There is a lot of uncertainty in these calculations, however. If technologies have been implemented earlier than 2022, or would be implemented faster, greater reductions could be achieved. Also, the projected productions in energy, agriculture and waste sectors are uncertain and depend strongly on price evolution, political situation, and policy. On 24 February, the political situation took a drastic turn with the invasion of Ukraine, which may have strong repercussions on energy production (among other things) and such unexpected events can of course not be accounted for in the projections.
Although world leaders are rightfully concerned about the war in Ukraine, it is important that they do not forget the Methane Pledge. Tackling methane emissions now is a must in order to have a chance of limiting global warming to 1.5°C. It is technically feasible to make significant reductions by 2030 - about 24% relative to 2020 levels given the projected production increases. Achieving the Methane Pledge of 30% will be very challenging but not impossible if increases in production could be curbed as well. The deciding factor is how quickly governments, businesses and local authorities will act.
Rona Louise Thompson is Senior Scientist at NILU – Norwegian Institute for Air Research Glen Peters is Research Director at CICERO Center for International Climate Research.
References
1) https://ec.europa.eu/commission/presscorner/detail/en/statement_21_5766
2) https://www.carbonbrief.org/guest-post-the-global-methane-pledge-needs-to-go-further-to-help-limit-warming-to-1-5c
3) On a 20-year time horizon methane is 81 times more powerful than co₂. Smith, C., et al.: The Earth’s Energy Budget, Climate Feedbacks, and Climate Sensitivity Supplementary Material. In: Climate Change 2021: The Physical Science Basis. Contribution of Working Group I to the Sixth Assessment Report of the Intergovernmental Panel on Climate Change, 2021. (Available from: https://IPCC.ch/static/ar6/wg1)
4) Hoegh-Guldberg, O., et al.: Impacts of 1.5°C Global Warming on Natural and Human Systems. In: Global Warming of 1.5°C. An IPCC Special Report on the impacts of global warming of 1.5°C above pre-industrial levels and related global greenhouse gas emission pathways, in the context of strengthening the global response to the threat of climate change, sustainable development, and efforts to eradicate poverty, 2018.
5) Saunois, M. et al.: The Global Methane Budget 2000-2017. Earth System Science Data 12, 1561–1623, 2020. (Available from: https://doi.org/10.5194/essd-12-1561-2020)
6) Lauvaux, T. et al.: Global assessment of oil and gas methane ultra-emitters. Science 375, 557–561, 2022. (Available from https://arxiv.org/abs/2105.06387)
7) Jackson, R. B. et al.: Increasing anthropogenic methane emissions arise equally from agricultural and fossil fuel sources. Environ Res Lett 15, 1–8, 2020. (Available from https://doi.org/10.1088/1748-9326/ab9ed2)
8) Fossil fuel production statistics (https://www.iea.org/data-and-statistics) and projections to 2030 from IEA World Energy Outlook STEPS scenario (https://www.iea.org/reports/world-energy-outlook-2021/fuels-old-and-new)
9) Historical waste production and projection from: Chen, D. M.-C. et al.: The worlds growing municipal solid waste: trends and impacts. Environ Res Lett 15, 074021, 2020. (Available from https://doi.org/10.1088/1748-9326/ab8659). Population data from the World Bank and projection from UN (https://www.un.org/development/desa/en/news/population/world-population-prospects-2017.html)
10) Agricultural production statistics and projection from FAO (https://www.oecd-ilibrary.org/agriculture-and-food/data/oecd-agriculture-statistics/oecd-fao-agricultural-outlook-edition-2021_4bde2d83-en?parentId=http%3A%2F%2Finstance.metastore.ingenta.com%2Fcontent%2Fcollection%2Fagr-data-en)
11) Climate and Clean-air Coalition: https://www.ccacoalition.org/en/content/benefits-and-costs-mitigating-methane-emissions
12) MethaneSAT (https://www.methanesat.org)
13) CarbonMapper (https://carbonmapper.org)
14) Nisbet, E. G. et al.: Methane Mitigation: Methods to Reduce Emissions, on the Path to the Paris Agreement. Rev Geophys 58, 2020. (Available from https://doi.org/10.1029/2019RG000675)
15) Höglund-Isaksson, L. et al.: Technical potentials and costs for reducing global anthropogenic methane emissions in the 2050 timeframe results from the GAINS model. Environ Res Commun 2, 025004, 2020. (Available from https://doi.org/10.1088/2515-7620/ab7457)
16) Harmsen, J. H. M. et al.: Long-term marginal abatement cost curves of non-co₂ greenhouse gases. Environ Sci Policy 99, 136–149, 2019. (Available from https://doi.org/10.1016/j.envsci.2019.05.013)
17) Calculations of the emission reductions are based on the maximum technologically feasible reductions for different sectors from Ref. 15, assuming these are implemented from 2022, combined with the production statistics from Refs. 7, 8 and 9.